Identify high energy consuming machines
OEE formula, and its components
OEE, or Overall Equipment Effectiveness, is a brilliant invention that, in a single number, tells you how much waste there is on your shop floor. It is the ratio of what you produced to what you could have produced – the actual output to the theoretical possible output. It tells you how efficiently you are using your equipment and your investment. This is the OEE formula.

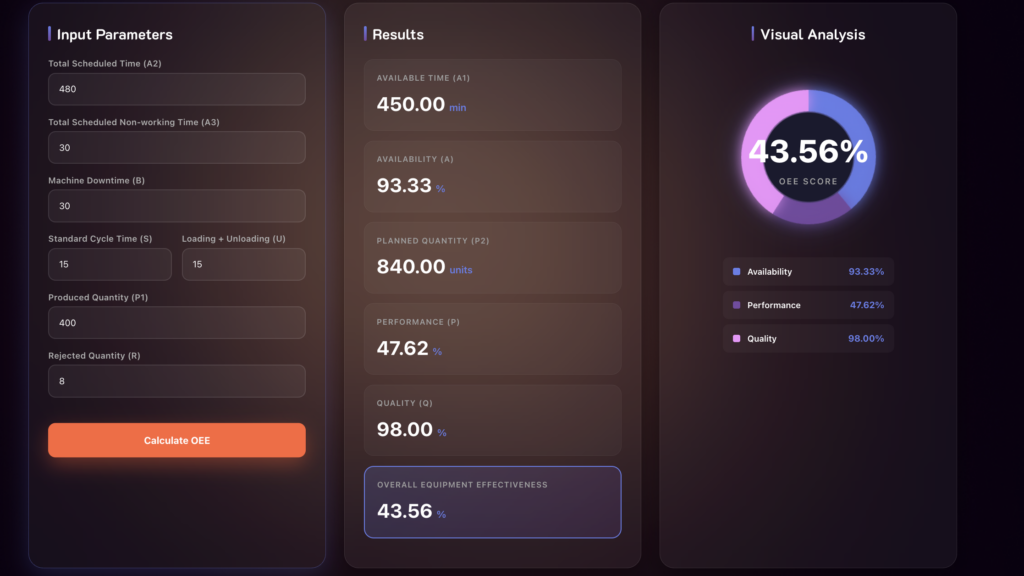
Try our free OEE Calculator
OEE = Availability x Performance x Quality
The components A, P and Q in the OEE formula can be summed up representing:
1. How much time did the machine run ?
2. How efficiently did it run while it was running ?
3. How many good parts did it produce while it was running ?
Availability: Is the machine operating or not? The ratio of the time that the machine was running, to the time that it could have actually run. The difference is because of idle time caused by breakdowns, setup, shift-change, etc.
Performance: How fast is the machine running? The ratio of the number of parts produced to the number of parts that theoretically could have been produced in the time that the machine was running. The difference could be because of inspection, insert changes, tool breakage, etc. between the start and end of a cycle. On a CNC machine, the difference could be due to using the feed rate or spindle speed override.
Quality: How many good parts were made? The ratio of the number of parts that pass quality inspection to the total number of parts made. The difference is the number of parts rejected. Calculating OEE allows you to measure and reduce waste (of available time, machine capacity, raw material) on the shop floor. It is a single number that you can communicate to, and is understood by, everybody from the machine operator to the CEO. It can be tracked month-on-month, improved upon.
Step-by-Step OEE Calculation Example (Real Factory Scenario)
Let’s walk through a real example using a CNC turning machine running a morning shift. No theory — just actual numbers, the way a production manager would calculate it at the end of a shift.
The Setup:
- Shift length: 8 hours (480 minutes)
- Planned breaks: 30 minutes
- Planned Production Time: 450 minutes
- Ideal cycle time: 2 minutes per part
What Actually Happened During the Shift
| Event | Time Lost |
|---|---|
| Spindle bearing failure (breakdown) | 45 minutes |
| Tool changeover | 15 minutes |
| Waiting for material | 10 minutes |
| Total Downtime | 70 minutes |
- Run Time = 450 − 70 = 380 minutes
- Total parts produced = 160 parts
- Rejected parts = 8 parts
- Good parts = 152 parts
Step 1 : Calculate Availability
Availability = Run Time ÷ Planned Production Time
= 380 ÷ 450
= 84.4%
Step 2 : Calculate Performance
Performance = (Total Parts × Ideal Cycle Time) ÷ Run Time
= (160 × 2) ÷ 380
= 320 ÷ 380
= 84.2%
Step 3 : Calculate Quality
Quality = Good Parts ÷ Total Parts
= 152 ÷ 160
= 95%
Step 4 : Calculate OEE
OEE = 84.4% × 84.2% × 95%
= 67.5%
What Does This Tell Us?
A 67.5% OEE means that out of every hour this machine was scheduled to run, it was only producing good parts for about 40 minutes. The rest was being eaten up by downtime, slow running, and rejects.
The biggest culprit here? Availability at 84.4% — driven mainly by that spindle bearing failure. That single breakdown cost 45 minutes of production time. If that machine had a real-time monitoring system alerting the maintenance team before the bearing failed completely, that 45 minutes is recoverable.
Want to skip the manual calculation entirely? Use the free Leanworx OEE calculator — plug in your numbers and get your OEE score instantly.
What Is a Good OEE Score? (Industry Benchmarks)
Here’s a question every plant manager asks: “We’re at 68% OEE — is that good or bad?”
The honest answer is: it depends on your industry. A 68% OEE in a job shop running 40 different part types is very different from a 68% OEE in a high-volume automotive line. Context matters.
That said, here are the generally accepted benchmarks:
General OEE Benchmarks
| OEE Score | What It Means | What to Do |
|---|---|---|
| 100% | Perfect production — theoretical only | Not a realistic target |
| 85% and above | World class | Focus on sustaining it |
| 70–85% | Good — above average | Fine-tune the weak factor |
| 60–70% | Average — typical for most plants | Identify top 3 loss reasons |
| Below 60% | Significant losses | Immediate action needed |
OEE Benchmark by Industry
| Industry | Typical OEE Range | World Class Target |
|---|---|---|
| Automotive (high volume) | 65–75% | 80–85% |
| CNC Machining / Job Shop | 50–65% | 75% |
| Plastic Injection Moulding | 60–70% | 80% |
| Pharmaceutical | 55–65% | 80% |
| FMCG / Packaging | 65–75% | 85% |
| Aerospace Components | 50–65% | 75% |
| Press / Sheet Metal | 55–70% | 78% |
The Most Important Benchmark Is Your Own
Here’s something most articles won’t tell you — the 85% world-class number was established by Seiichi Nakajima, the creator of TPM, back in the 1980s. It was based on discrete, repetitive manufacturing lines. Your factory might be completely different.
The most useful benchmark is your own historical data. If your OEE was 58% last quarter and it’s 65% this quarter — that’s a win, regardless of what the industry average says. Direction matters more than the absolute number.
The manufacturers who improve fastest are the ones tracking OEE shift-by-shift, machine-by-machine — not just looking at monthly averages.
See how Leanworx tracks OEE in real time across every machine on your shop floor.
What are the losses in the OEE formula ?
| Type of Loss | Meaning | Examples |
|---|---|---|
| L1 – Not scheduled for production | Time when the machine is not planned to run | Non-working shifts, holidays, lunch breaks, tea breaks |
| L2 – Failure, Idle time | Time when the machine is planned to run, but is not running. This includes all events that stop production long enough where it makes sense to track a reason for the downtime (typically several minutes). | Setup, machine breakdown, inspection, accident, no raw material, power shutdown, part unloading and loading. |
| L3 – Minor stops, Speed loss | Machine running at lower than normal production rate, and downtimes of duration so small that it does not make sense to track the reason for the downtime. | Part unload/load time that is longer than the standard unload/load time, cycle times that are longer than the standard cycle time, rework. |
| L4 – Scrap | Number of rejected parts. | Rejection quantity |
Availability
Availability = 100 x (Running time / Available time)
Performance
Performance = 100 x (Real production / Theoretical production)
If you are running a single part,
P = No. of parts produced / No. of parts that could have been produced
OR
P = (No. of parts produced x Std. cycle time of part) / Running time
If you are running multiple parts,
P = Σ(No. of parts produced x Std. cycle time of part) / Running time
Quality
Quality = 100 x (No. of good parts produced / Total parts produced)
OEE: A x P x Q
Example
A machine works 24 hours a day, in 3 shifts of 8 hours each.
Each shift has a break time of 30 min. (total 1.5 hrs. each day).
The standard cycle time of the part is 29 minutes. The standard part unload-load time is 1 minute. Each part therefore takes 30 minutes.
There is a downtime of 4 hours, caused by machine breakdown, waiting for raw material and power shutdown.
35 parts are made.
1 part is rejected.
Available time = 22.5 hrs. (24 – 1.5 hrs. breaks)
Running time = 18.5 hrs. (22.5 – 4 hrs downtime)
Availability = 100 x (18.5 / 22.5) = 82.2 %
Theoretical production = 37 pieces (18.5 / 0.5). Running time is 18.5 hrs, and each part takes 30 minutes.
Real production = 35
Performance = 100 x (35 / 37) = 94.6 %
Real production = 35 parts
Good parts = 34 (35 – 1 rejection)
Quality = 34 / 35 = 97.1 %
OEE = 100 x (.822 x .946 x .971) = 75.4 %.
Getting wrong numbers of OEE, Availability, Performance and Quality ? Here is an explanation on problems and fixes while calculating OEE.
Cooked up OEE formula - the harm

OEE is not something that you show others. It is something that you see yourself, to improve the capacity utilization and profitability of your machines. OEE is a number that you must constantly strive to improve, not a number that you achieve and then relax forever. This is the reason that in the OEE formula, it is important that you are truthful about losses like downtimes, rejections and rework. Manipulation in calculating OEE numbers may serve some short term aims, but are very harmful in the long term.
The most common way getting the OEE formula to give you (falsely) nice numbers is to manipulate the Availability. A lot of firms consider some common downtimes as part of the process, and NOT as downtimes. E.g., part unloading and loading, insert change, periodic inspection, setup change. This is against the logic behind calculating OEE. It artificially inflates the OEE number, and is the equivalent of hiding the dirt under the carpet.
Availability is defined as = Run time / Planned production time.
Run time = Planned production time – Downtime.
Downtime is the time when the process was supposed to be running but did not run. This includes part unloading and loading, inspection, setup changes, breakdowns, etc.
Why you must consider ALL downtimes as downtimes
You can get an artificially high Availability by excluding some down times, so the numerator in the Availability equation goes up. However, if you do this, you’ll just conclude that there no further improvement is possible, and then just sit back and relax. Example: let’s say the setup time for a part on a CNC machining center is 3 hours. If you consider this as as a part of the process instead of a downtime, you will never try to improve, and this setup time will remain constant for years together. Fixturing, tooling and machines may change and enable the setup time to be reduced, but you are not even looking at these because the high setup time does not show up in the OEE calculation. If you DO consider it as downtime, you’ll keep on trying to reduce it, by using quick change tooling, automatic tool presetter, etc. This applies to all downtimes, and can cause enormous harm to your productivity and working culture.
OEE formula manipulation - example 1
While calculating OEE, do not consider setup change times as downtime, because “How can you consider this a downtime ? After a batch of parts is completed, we have to do a setup change, right ? We must therefore consider it as a part of the cycle”. The result: Maybe you can reduce a 1 hour setup time to 20 minutes by using quick change tooling, a tool presetter, or by work and tool offset probes. You will never do this, because you have hidden this downtime waste forever and will forget that it exists.
OEE formula manipulation - example 2
In the Performance part of the OEE formula, make the whole part change time (unload-load time) a part of the cycle time, because “How can this be a downtime ? You have to unload the completed part and load a new part, right ? So it’s actually part of the cycle”. The result: Maybe you can switch to a pallet changer, or better and faster clamps on the fixture, a better and faster crane, or a robot. These will reduce the part change time, but you will never do this, because you have hidden this machine downtime and will never realize that it exists.
OEE formula manipulation - example 3
In the Availability part of the OEE formula, do not consider part inspection, periodic machine cleaning and tool change times as downtime, because you think these are a necessary part of the process. The result: Maybe you can reduce the periodic cleaning time with an automatic air blast, reduce the frequency of tool changes by using longer lasting tools. Maybe you can speed up the inspection or reduce its frequency. Since these machine downtimes are hidden forever and not highlighted in the OEE, your shop floor’s culture and system will forever ignore these downtimes because they do not exist.
As you can see, the result of cooking cooking up the OEE formula has long term consequences. There really is no point in inflating OEE numbers by hiding downtimes. Do not treat OEE as an absolute number like a pass or fail number, that needs to be achieved by hook or crook. Instead, use it as a number that shows your real productivity that needs to be improved constantly. Set a target for periodic incremental improvement, like 1 or 2 % per month. Just be truthful about all the downtimes and let them be visible, so that you will always keep looking for ways to reduce them.
This is the key principle of calculating OEE in your LEAN journey – be honest about your wastes. Do not hide them.
What is TEEP ?
TEEP definition, TEEP calculation, and OEE vs. TEEP difference.
Losses on the shop floor can be divided into Equipment losses and Schedule losses.
Equipment losses are the losses (downtime and rejections) in the time that a machine is scheduled to run. This is measured by OEE.
Schedule losses are the time that the machine was not scheduled to run, but was available to run. E.g., lunch and tea breaks, non-working shifts, holidays, no orders. This is measured as Utilization.
OEE is how effectively you have used the scheduled production time. TEEP is how effectively you have used ALL the time, which is 24 hours a day, 7 days a week.
TEEP considers both equipment losses AND schedule losses, ie. OEE AND Utilization.
TEEP calculation
Using the OEE formula itself
This is the Availability calculation in the OEE formula.
Availability = 100 x (Running time / Available time)
The Available time in OEE excludes all scheduled downtimes – like meal breaks, holidays, no planned production, preventive maintenance.
To calculate TEEP, simply use the TOTAL time including all scheduled downtimes.
Calculating OEE and then getting TEEP
Utilization = Planned production time / Total available calendar time
TEEP = OEE x Utilization.
Example 1
A machine’s OEE is 60 %. It runs 24 hours a day, without any breaks, 6 days a week.
The Utilization is 6/7, or 85.7 %.
TEEP = 100 x ((OEE/100) x (Utilization/100)) = 51.4 %
Example 2
A machine’s OEE is 60 %.
It works 12 hours a day, with lunch and tea breaks totaling 1 hour, 6 days a week.
Utilization is (11 x 6)/(24 x 7), 39.3 %
TEEP = 100 x ((OEE/100) x (Utilization/100)) = 23.6 %
Why should you be using TEEP ?
When you get a loan from a bank to buy a machine, you need to repay the bankers the principal + interest on the loan every month. The bankers do not care how many hours you run the machine. If you run the machine only 12 hours a day, your revenue is half of what it could have been if you had run it 24 hours a day. It makes sense to run the machine longer hours – run it 24 hours, across weekly off days. TEEP makes more sense than OEE as a measure of your ability to repay the bank loan.
OEE vs TEEP What is the Difference and Which One Should You Track?
If you’ve been researching OEE, you’ve probably come across TEEP at some point and wondered — are these the same thing? They’re related but they answer completely different questions.
The Simple Explanation
- OEE asks: “How well are we using the time we’ve already scheduled?”
- TEEP asks: “How well are we using this machine’s total potential — including all the hours it sits idle?”
The Key Difference
This is where they split apart:
| OEE | TEEP | |
|---|---|---|
| Full form | Overall Equipment Effectiveness | Total Effective Equipment Performance |
| Baseline time used | Planned production time (scheduled shifts only) | All calendar time (24 hours × 365 days) |
| Includes idle time? | No | Yes |
| World class benchmark | 85% | ~23% |
| Best used for | Improving efficiency within existing shifts | Strategic capacity planning and investment decisions |
A Quick Example
Say your machine runs one shift (8 hours) in a 24-hour day and achieves 80% OEE during that shift.
- OEE = 80% — Great! You’re using your scheduled time well.
- TEEP = 80% × (8 ÷ 24) = 26.7% — Because the machine sat idle for 16 hours.
TEEP isn’t saying you’re performing badly. It’s saying there’s theoretical capacity sitting unused — which is useful to know if you’re deciding whether to add a second shift or buy a new machine.
Which One Should You Focus On?
For most shop floor managers and production heads — start with OEE. Fix the losses in your current shifts first. Once your OEE is consistently above 75–80%, then look at TEEP to make strategic decisions about capacity.
Tracking both at the same time without fixing the basics first is like renovating your second floor while the ground floor is leaking. Sort OEE first.
How to Improve Your OEE Score (Practical Steps That Actually Work)
Knowing your OEE score is step one. Improving it is where most factories get stuck — not because they don’t know what to do, but because they don’t know which loss to attack first.
Here’s how to approach it systematically.
Step 1 — Find Your Biggest Loss Category First
Look at your three OEE factors and find the lowest one. That’s where your improvement effort should go — not equally across all three.
If Availability is lowest → your problem is breakdowns and downtime. Focus on maintenance and faster changeovers.
If Performance is lowest → your problem is micro-stops and slow running. Focus on operator training and process stability.
If Quality is lowest → your problem is defects and rework. Focus on root cause analysis and process controls.
Step 2 — Track Downtime Reasons, Not Just Downtime Duration
Most factories know their machine was down for 2 hours. Very few know why it was down for 2 hours — breakdown, changeover, no operator, waiting for material?
Without reason codes, you’re guessing at solutions. With reason codes, you can see your top 3 downtime causes and attack them directly. In most factories, 80% of downtime comes from just 3–4 recurring reasons.
Step 3 — Stop Ignoring Micro-Stops
A micro-stop is any stoppage under 5 minutes — a part jam, a sensor false trigger, an operator adjustment. Nobody logs it. Nobody reports it. But 10 micro-stops of 3 minutes each = 30 minutes of lost production per shift, invisible in your data.
This is the single biggest hidden loss in most manufacturing plants. The only way to catch micro-stops is through automated machine monitoring — because no operator is going to log a 2-minute stop on a paper sheet.
Step 4 — Set Realistic Targets, Not Arbitrary Ones
Don’t set “85% OEE by next quarter” as a target if you’re currently at 58%. That’s a recipe for frustration and data manipulation (operators fudging numbers to hit targets).
Instead, target a 3–5% improvement per quarter. Consistent, compounding improvement beats a big jump that doesn’t stick.
Step 5 — Move From Shift Reports to Real-Time Visibility
The fundamental problem with paper-based or manual OEE tracking is that by the time you see the data, the shift is over. You can analyse it but you can’t fix it.
Real-time OEE monitoring means your supervisor sees a machine drop below target during the shift — while there’s still time to intervene, reassign work, or call maintenance.
That’s the difference between reacting to yesterday’s losses and preventing today’s.
Leanworx automatically tracks Availability, Performance, and Quality for every machine on your shop floor — in real time, without manual data entry. See how it works →
“Not sure what world-class OEE looks like for your industry?
Try Leanworx for Free.
For 1 Machine
Get live reports, real-time dashboards, mobile alerts, and full production visibility exactly like our paid customers.
FAQs:
1. What is the standard OEE formula used in manufacturing?
OEE = Availability × Performance × Quality
Each factor is calculated separately:
- Availability = Run Time ÷ Planned Production Time
- Performance = (Ideal Cycle Time × Total Count) ÷ Run Time
- Quality = Good Count ÷ Total Count
The final OEE score is expressed as a percentage. A score of 100% means your machine ran exactly as planned, at full speed, with zero defects.
2. How do you calculate OEE step by step?
Step 1 — Calculate Availability Take your planned production time (say 8 hours = 480 minutes). Subtract all downtime (breakdowns, changeovers). If downtime was 60 minutes, run time = 420 minutes. Availability = 420 ÷ 480 = 87.5%
Step 2 — Calculate Performance If your ideal cycle time is 1 minute per part, and the machine ran for 420 minutes but only produced 350 parts: Performance = 350 ÷ 420 = 83.3%
Step 3 — Calculate Quality If out of 350 parts, 330 were good and 20 were rejected: Quality = 330 ÷ 350 = 94.3%
Step 4 — Multiply all three OEE = 87.5% × 83.3% × 94.3% = 68.8%
3. What is considered a world-class OEE percentage?
A world-class OEE score is generally considered to be 85% or above. Here’s how scores are typically interpreted:
| OEE Score | What It Means |
|---|---|
| 100% | Perfect production — theoretical maximum |
| 85%+ | World class — benchmark for best-in-class manufacturers |
| 60–85% | Typical for most manufacturing plants — room to improve |
| Below 60% | Significant losses — immediate action needed |
It’s worth noting that 85% is a general benchmark. The right target depends on your industry, machine type, and production mix. A job shop running 50 different parts will naturally score lower than a high-volume dedicated line.
4. Can OEE be greater than 100%?
Technically yes, but it signals a data problem, not exceptional performance.
OEE can appear above 100% when:
- Your ideal cycle time is set too slow (machine is actually faster than the baseline)
- Planned production time is underreported in your system
- There are data entry errors in your tracking sheet
If you’re seeing OEE above 100%, the first thing to do is review your ideal cycle time setting. It’s almost always set to the average speed rather than the true maximum speed of the machine. Fixing this brings your OEE back to a realistic number and gives you an honest picture of actual losses.
5. How is OEE different from TEEP?
Both measure equipment effectiveness, but they use different baselines:
| OEE | TEEP | |
|---|---|---|
| Baseline | Planned production time | All available calendar time (24×7×365) |
| Includes | Only scheduled shifts | All hours including unscheduled time |
| Best for | Improving within existing shifts | Strategic capacity planning |
| World class | 85% | ~23% (because denominator is much larger) |
Simple way to think about it: OEE tells you how well you’re using the time you’ve already scheduled. TEEP tells you how well you’re using your machine’s total potential — including nights, weekends, and holidays when it sits idle.
Most shop floors should focus on OEE first. TEEP becomes relevant when you’re considering whether to add a shift or buy a new machine.
6. What causes low OEE in manufacturing?
Low OEE is caused by losses across three categories:
Availability Losses (machine not running)
- Unplanned breakdowns and equipment failures
- Long changeover and setup times
- Waiting for materials, operators, or tools
Performance Losses (machine running slowly)
- Micro-stops and minor stoppages that don’t get logged
- Operator running machine below ideal speed
- Worn tooling causing the machine to slow down
Quality Losses (parts being rejected)
- Startup rejects after a changeover
- Process variation causing defects mid-run
- Incorrect machine parameters or material issues
The most common hidden cause is micro-stops — pauses of less than 5 minutes that nobody records but add up to 1–2 hours of lost production per shift. Most factories only discover this when they start tracking data automatically in real time.