Contact Us

Leanworx measures OEE automatically, straight from your CNC machines. See availability, performance and quality for every machine and shift in real time, find the losses dragging your OEE down, and fix them while the shift is still running.
Real-time OEE tracking for Fanuc, Siemens, Mitsubishi, Haas and Brother controllers.
Used by manufacturers including TaeguTec India, SSS Springs, Zenith Precision and RBD Engineers.
Demo data for illustration.
Collects OEE data directly from the controllers already on your machines
OEE monitoring software measures Overall Equipment Effectiveness automatically by collecting data from your machines. It tracks availability, performance and quality in real time, calculates OEE for every machine, shift and day, and shows which losses are holding production back. It replaces manual OEE spreadsheets with accurate, live numbers.
OEE combines three factors into one score:
OEE = Availability × Performance × Quality
Availability is the share of planned time the machine actually ran. Performance compares actual speed with ideal cycle time. Quality is the share of good parts. Our guide to the OEE formula walks through each one with examples, and you can try the numbers yourself in the OEE calculator.
The problem is not the formula. It is the data. When OEE is calculated from operator logs, short stops disappear, slow cycles go unnoticed and the score looks better than reality. OEE software takes the inputs straight from the machine, so the number you report is the number you actually achieve.
Everything you need to measure, understand and improve OEE on the shop floor.
See live OEE for each machine, cell and plant, updated through the shift. Spot a machine slipping below target while there is still time to act.
Every OEE score is split into its three factors, so you know whether to attack downtime, slow cycles or rejections first.
Each stoppage is captured with exact start and end times, and operators tag the reason. A downtime Pareto shows which causes cost the most OEE.
Actual cycle times from the controller are compared with standard times, so slow programs, reduced speeds and small stops show up in the numbers.
Compare OEE by shift, operator, part or machine to find the best practice in your own plant and spread it.
Daily, weekly and monthly OEE reports are generated for you, ready for the morning meeting, with no spreadsheet work. See how this replaces the daily production report.
Track OEE week over week and compare it with world-class OEE so improvement targets are based on real data.
Show live OEE on andon boards for operators, and check any plant from a browser or phone with remote monitoring.
Real screens from Leanworx: the OEE views your supervisors and plant heads use every shift.

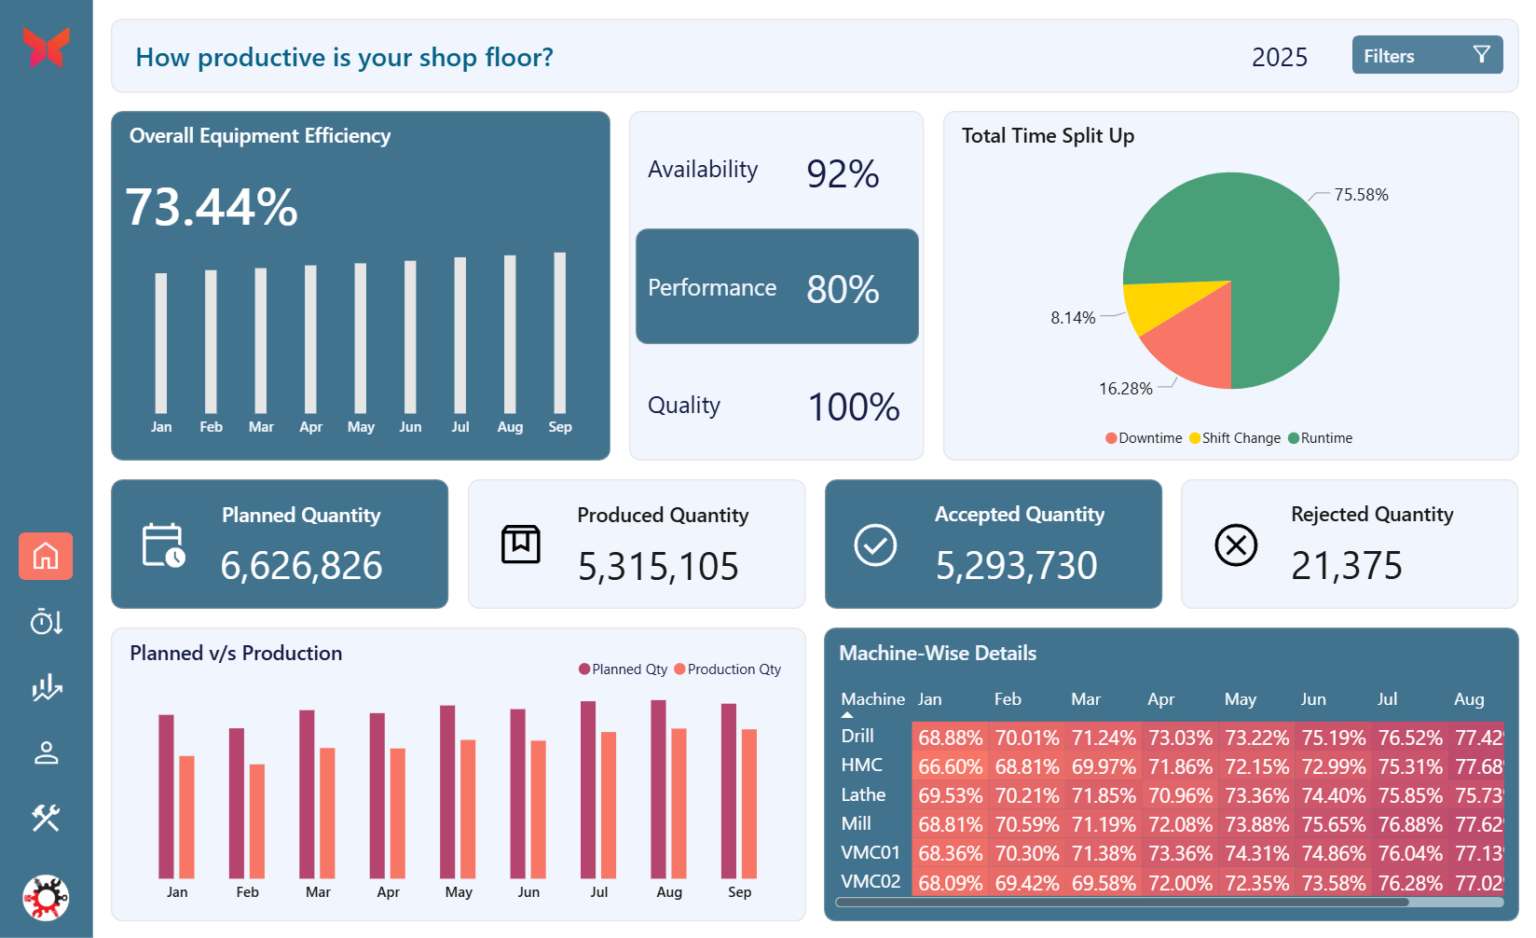
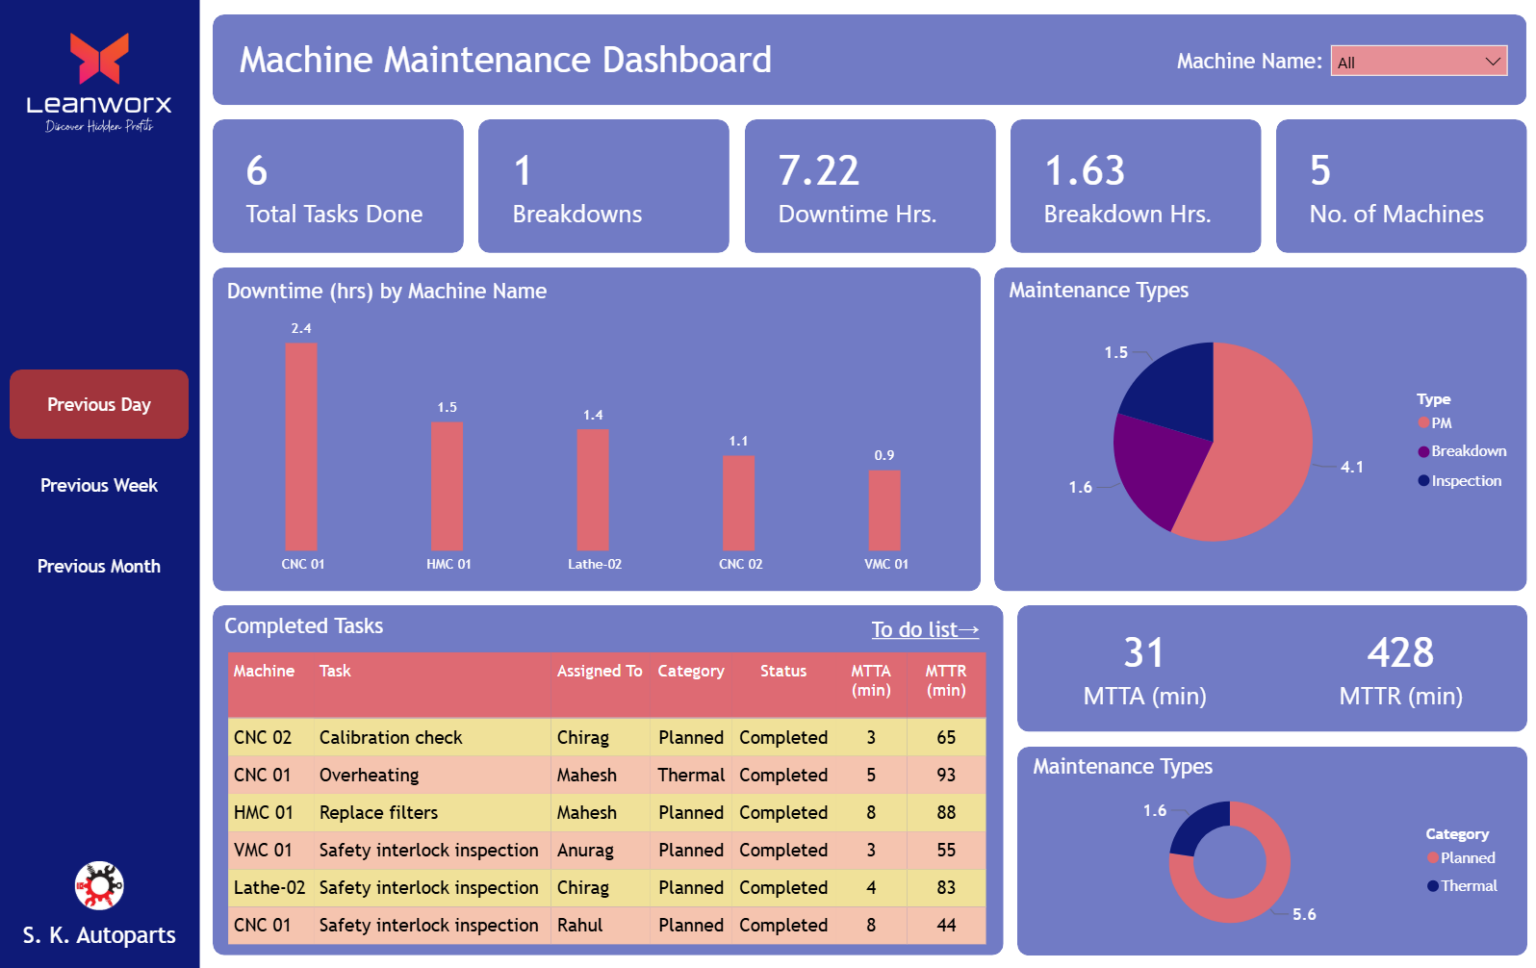
Every point of lost OEE comes from one of six losses. Leanworx measures each one at the source, so you can see exactly where your OEE is going.
| Loss | OEE factor | How Leanworx captures it |
|---|---|---|
| Breakdowns | Availability | Machine stoppages logged automatically, with operator-tagged reasons |
| Setups and adjustments | Availability | Setup time recorded per job, so changeovers can be measured and reduced |
| Small stops | Performance | Short idle periods captured from controller status, even the ones nobody writes down |
| Reduced speed | Performance | Actual cycle time compared with ideal cycle time for every part |
| Startup rejects | Quality | Rejected parts recorded against the machine, job and shift |
| Production rejects | Quality | Rejections tracked over time, ready for rejection analysis |
Want to put a cost on these losses? Read the cost of OEE losses and how to improve OEE.
Three steps from spreadsheet OEE to real-time OEE you can trust.
Leanworx reads data from each machine's controller over your shop network. Part programs and operator routines stay exactly the same. Older machines can be connected through an IoT device.
Run time, stoppages, cycle times and part counts flow in continuously. Availability, performance, quality and OEE are calculated for every machine, shift and day.
Loss breakdowns and downtime Paretos point to the causes costing the most OEE, so improvement work goes where it pays back fastest.
Why OEE from a spreadsheet is usually higher than your real OEE.
| Spreadsheet OEE | Leanworx OEE software | |
|---|---|---|
| Data source | Operator logs filled in after the fact | Directly from the CNC controller |
| Small stops | Rarely recorded | Captured automatically |
| Cycle time losses | Hidden inside "running" time | Measured against ideal cycle time |
| When you see OEE | Next day or end of month | Live, during the shift |
| Level of detail | Plant or line average | Every machine, shift, operator and part |
| Effort | Hours of data entry every week | None after setup |
Commonly used OEE benchmarks for discrete manufacturing. Measuring OEE accurately is the first step to knowing where you really stand.
The widely cited benchmark for best-in-class discrete manufacturers.
Common for manufacturers that track OEE but still have room to improve.
Often seen when OEE is first measured from real machine data.
See benchmarks by industry in our guides to world-class OEE and OEE benchmarks.
What manufacturers say after moving to real-time OEE monitoring.
With Leanworx we have been able to bring down our machine downtime by about 30% and increase in OEE by 10 to 15%, which is a huge saving. We have been getting fantastic results out of it. The reports that we generate every morning give us a good insight on the productivity and the performance of the operator as well as the machine.
OEE they can actually trust
When a customer asks, what is your OEE? We say 85%. Are we really at 85%? I don't think so. After installing Leanworx and improving systems, it's 88 when we finally checked the last time. So that's a substantial advantage.
30% to 55% spindle utilization
We've seen a lot of OEE improvements because now we can understand the parts, the spindle runtime, how effectively we are running. It's actually helped us to move from 3 shifts down to 2 shifts with more output. So we've moved from about 30% spindle utilization to now over 55% spindle utilization.
8 to 10% efficiency gain
Overall, I see at least 8 to 10% efficiency improvement, especially OEE and the spindle run time. Setup time has been reduced and we can see an improvement of at least 10 to 12% production improvement.
No more arguing about the data
After implementing Leanworx we are no longer discussing the quality of data or accuracy of data. Discussion revolves around what can be done to improve productivity. Looking at the benefit of utilizing and improving the equipment utilization, the incremental cost that we incur by paying the subscription is very small and it's a good value proposition from our point of view.
25% less night-shift downtime
Our downtime has decreased by 10%. The downtime, especially in the night shift, has reduced by more than 25%, which is a very, very important thing for us and is contributing a lot towards our productivity.
10 minutes to connect a machine
It takes hardly 10 minutes for a person to connect to the machine. I can tell you that we are able to reduce the downtime, and we are able to improve productivity. The middle level supervisors and managers are also satisfied with the exact data that they are getting from the Leanworx system.
Leanworx Lite gives smaller shops automatic OEE, live machine status and daily reports without an IT team. Start free and connect your first machines yourself.
Try Leanworx free See plans and pricingFor 20 or more machines, or several plants, our team plans the rollout with you and sets up OEE dashboards for production, maintenance and management.
Book a walkthroughOEE monitoring software collects data from your machines and calculates Overall Equipment Effectiveness automatically. It shows availability, performance, quality and OEE in real time for every machine and shift, and highlights the losses holding production back.
OEE = Availability × Performance × Quality. Availability is run time divided by planned production time, performance is actual output compared with output at ideal cycle time, and quality is good parts divided by total parts. Leanworx calculates all three from machine data.
85% is widely cited as world-class OEE for discrete manufacturing. Around 60% is typical, and many plants see about 40% when they first measure OEE from real machine data.
Leanworx connects to the CNC controller over your shop network and reads machine status, cycle times and part counts automatically. Operators add downtime reasons and rejected parts. Older machines can be connected through an IoT device.
Yes. Leanworx updates OEE continuously through the shift, so supervisors can see a machine falling behind and act before the shift ends.
Machine monitoring software shows what each machine is doing: running, idle or down, part counts and downtime. OEE software uses that data to calculate availability, performance, quality and OEE. Leanworx does both in one system. Learn more about our CNC machine monitoring software.
Results depend on your starting point. Leanworx customers report gains such as 10 to 15% higher OEE at RBD Engineers and 8 to 10% efficiency improvement at CIM Tools.
Leanworx is a subscription priced by the number of machines, and you can try it free on your own machines first. See current plans on the pricing page.
Yes. Small shops often lose the most hours to unmeasured downtime and slow cycles. Leanworx Lite is designed for job shops with a few machines and no dedicated IT team.
Connect a machine and watch availability, performance and quality update in real time. Your programs stay exactly as they are.
Try Leanworx free